Chart the Ratings

Display Chart For:


Show
Season

Compare With:


Show
Season


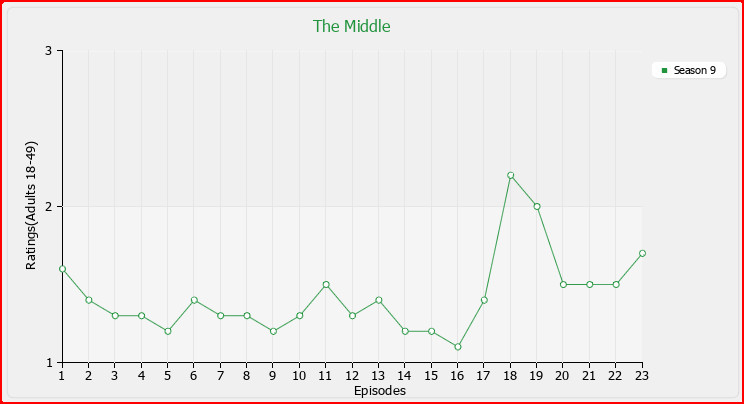
 Rating = 1.6<br />Oct 3, 2017  Rating = 1.4<br />Oct 10, 2017  Rating = 1.3<br />Oct 17, 2017  Rating = 1.3<br />Oct 24, 2017  Rating = 1.2<br />Oct 31, 2017  Rating = 1.4<br />Nov 7, 2017  Rating = 1.3<br />Nov 14, 2017  Rating = 1.3<br />Nov 21, 2017  Rating = 1.2<br />Dec 5, 2017  Rating = 1.3<br />Dec 12, 2017  Rating = 1.5<br />Jan 2, 2018  Rating = 1.3<br />Jan 9, 2018  Rating = 1.4<br />Jan 16, 2018  Rating = 1.2<br />Feb 6, 2018  Rating = 1.2<br />Feb 27, 2018  Rating = 1.1<br />Mar 13, 2018  Rating = 1.4<br />Mar 20, 2018  Rating = 2.2<br />Apr 3, 2018  Rating = 2.0<br />Apr 10, 2018  Rating = 1.5<br />May 1, 2018  Rating = 1.5<br />May 8, 2018  Rating = 1.5<br />May 15, 2018  Rating = 1.7<br />May 22, 2018

How to use our charts

1. Select a show from under the "Display Chart For" heading.
2. The show's most recent season will be displayed under it, but there may be others to choose from.
3. You can also select a second show for comparison under the "Compare with" heading.
4. Click the "Get Chart" button to display the chart for the selected shows.
5. Hover your mouse over points on the chart to see each episode's rating and air date.


Tip: Comparing charts is most useful if you select shows from similar timeslots and genres.
      (Example: Compare two dramas that air Mondays at 8:00pm)